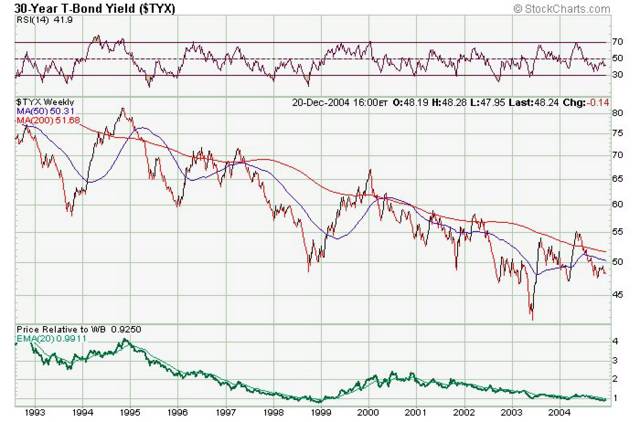
1995 BUY BONDS & WACHOVIA 1999 & 2005 SELL BONDS & WACHOVIA(click to enlarge)
The following three blogs have charts that relate to banking. Read them all to get the full picture. The above chart is the one of a 1000 words. This chart shows the yield of the 30 year treasury bond relative to WB. In '95 when long rates peaked, WB bottomed and vice versa in 1999. We are currently back to the 1999 scenario. WB relative to TYX is at the low. See the chart below on refinancing! Fees are going down! 
Tuesday, December 21, 2004
1995 BUY TYX & WACHOVIA 1999 & 2005 SELL TYX & WACHOVIA
Subscribe to:
Post Comments (Atom)


0 comments:
Post a Comment